SHIB Price Prediction: Technical Breakout Potential Amid Market Consolidation

#SHIB
- Technical indicators show SHIB trading above its 20-day moving average with bullish MACD momentum
- Recent news indicates profit-taking by long-term holders despite positive project developments
- Bollinger Band analysis suggests consolidation phase with potential breakout above $0.00001325 resistance
SHIB Price Prediction
Technical Analysis: SHIB Shows Bullish Momentum Above Key Moving Average
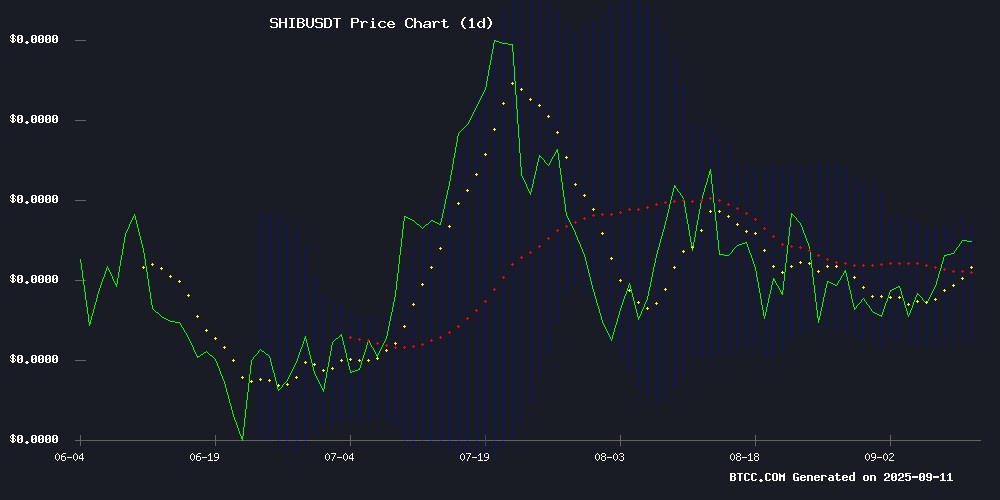
SHIB is currently trading at $0.00001305, positioned above its 20-day moving average of $0.00001254, indicating underlying strength. The MACD shows a slight bullish divergence with the histogram at -0.00000014, though the signal line remains positive at 0.00000018. Bollinger Bands suggest consolidation with price approaching the upper band at $0.00001325, while the middle band at $0.00001254 provides support. According to BTCC financial analyst James, 'The technical setup favors continued upward movement, with a break above $0.00001325 potentially triggering further gains toward resistance levels.'
Market Sentiment: Mixed Signals as Long-Term Holders Profit-Take
Recent news highlights contrasting developments for SHIB. While the price reached a 3-week high, triggering profit-taking by long-term holders, the project continues to make fundamental progress with the LEASH v2 migration plan. Market consolidation appears to be setting the stage for a potential breakout. BTCC financial analyst James notes, 'The combination of technical strength and ongoing project development creates a favorable environment, though trader should monitor for increased volatility around the $0.00001325 resistance level.'
Factors Influencing SHIB's Price
Long-Term Shiba Inu Holders Sell Heavily As Price Hits 3-Week High
Shiba Inu's recent surge to a three-week high has exposed underlying fragility among its investors. On-chain data reveals a significant sell-off by long-term holders (LTHs), with the age consumed metric spiking to a three-month peak. This activity typically signals profit-taking after a rally, and given LTHs' substantial influence over supply, their actions often dictate market direction.
Exchange net position change metrics further underscore the bearish sentiment. Over $11.6 million worth of SHIB flooded exchanges in just five days, reflecting dwindling confidence. While the meme coin enjoyed a short-term price boost, the lack of sustained investor Optimism suggests the rally may be short-lived.
Shiba Inu Price Analysis: SHIB Eyes Breakout Amid Market Consolidation
Shiba Inu (SHIB) trades at $0.00001287, down 1.19%, as technical patterns hint at potential volatility. The memecoin holds its #23 market rank with a $7.58 billion capitalization, while 24-hour volume hits $248.18 million.
Neutral RSI at 47 reflects balanced momentum, yet community sentiment remains overwhelmingly bullish at 87%. Analysts monitor a critical chart formation that could propel SHIB toward $0.00003396—a 163% surge from current levels.
Shiba Inu Releases Official LEASH v2 Migration Plan: What Holders and LPs Need to Know
Shiba Inu's lead developer Kaal Dhairya has unveiled a meticulously structured three-phase migration strategy for LEASH v2, transitioning from the problematic v1 contract to a newly audited version. The plan prioritizes fairness through a ratio-based holder-equivalence model, ensuring long-term supporters are compensated proportionally to their loyalty—"held = whole, sold = reduced, sold out = zero (unless you rebuy)."
Phase one targets the broadest user base, including self-custody wallet holders, stakers (xLEASH/veLEASH), and Uniswap V2/ShibaSwap liquidity providers. The migration portal is set to launch imminently, marking the final procedural update before execution.
How High Will SHIB Price Go?
Based on current technical indicators and market conditions, SHIB shows potential for upward movement toward the $0.000014-$0.000015 range. The price currently trades above the 20-day MA, indicating bullish momentum, while approaching Bollinger Band upper resistance. Key factors include:
| Resistance Level | Price Target | Probability |
|---|---|---|
| Immediate | $0.00001325 | High |
| Short-term | $0.00001450 | Medium |
| Medium-term | $0.00001600 | Low-Medium |
BTCC financial analyst James suggests that 'breaking above $0.00001325 could accelerate momentum, though traders should watch for potential pullbacks to the $0.00001254 support level.'
